
An Electron 'Movie' Catches Light Driving Quantum Jumps in Graphene
Published October 29, 2026
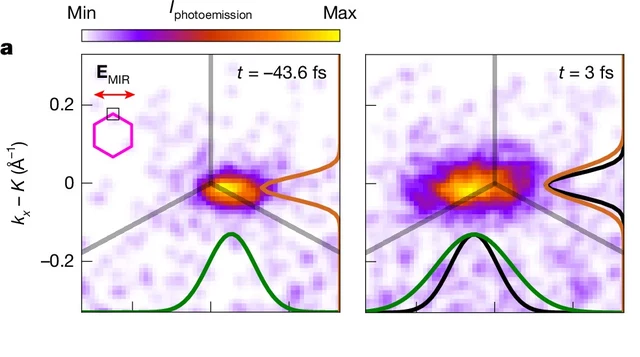
Cropped Figure 3a: measured momentum-space distributions at two delays, not real-space electron photographs. Credit: V. Eggers et al., Nature, DOI 10.1038/s41586-026-11214-y.
Image credit
Cropped measured momentum distributions from Figure 3a
V. Eggers et al. · CC BY 4.0Cropped to the two upper-left measured distributions in Figure 3a, retaining times, legend and axes; resized and encoded as WebP. Not a real-space photograph.
A Nature experiment maps light-driven electronic dynamics across graphene's momentum space. Sub-10-femtosecond frames and attosecond timing precision are different claims.
To watch light control electrons, researchers need more than a fast shutter. They need a way to identify which electronic states are occupied, how that distribution changes and where those changes fall within an oscillating light field.
A Nature study published October 28 brings those measurements together in graphene. Its authors describe subcycle band-structure videography: snapshots of electronic behavior taken on a timescale shorter than one cycle of the driving light. The experiment tracks the interplay between electrons accelerating within an energy band and undergoing quantum transitions between bands.
The result is sometimes described as an electron movie. It is not ordinary camera footage of individual electrons visibly leaping across a sheet of carbon.
Measure the Distribution, Not a Tiny Trajectory
The experiment probes electrons in momentum space. That means organizing the measurement by quantities related to motion and energy, rather than producing an everyday spatial photograph of little particles at particular locations.
The distinction matters when reading the colored maps. A bright region represents a stronger photoemission signal in part of the measured distribution. When that region shifts or stretches, the researchers can investigate how the population of electronic states is changing. It is not a photograph of an electron physically changing from a round object into an ellipse.
The study's images make two effects visible together: a displacement of the distribution and a change in its shape. A simple acceleration-only picture would not explain every part of that evolution. Resolving the shape change helps the team examine coupling between electronic bands rather than infer everything from a single current trace.
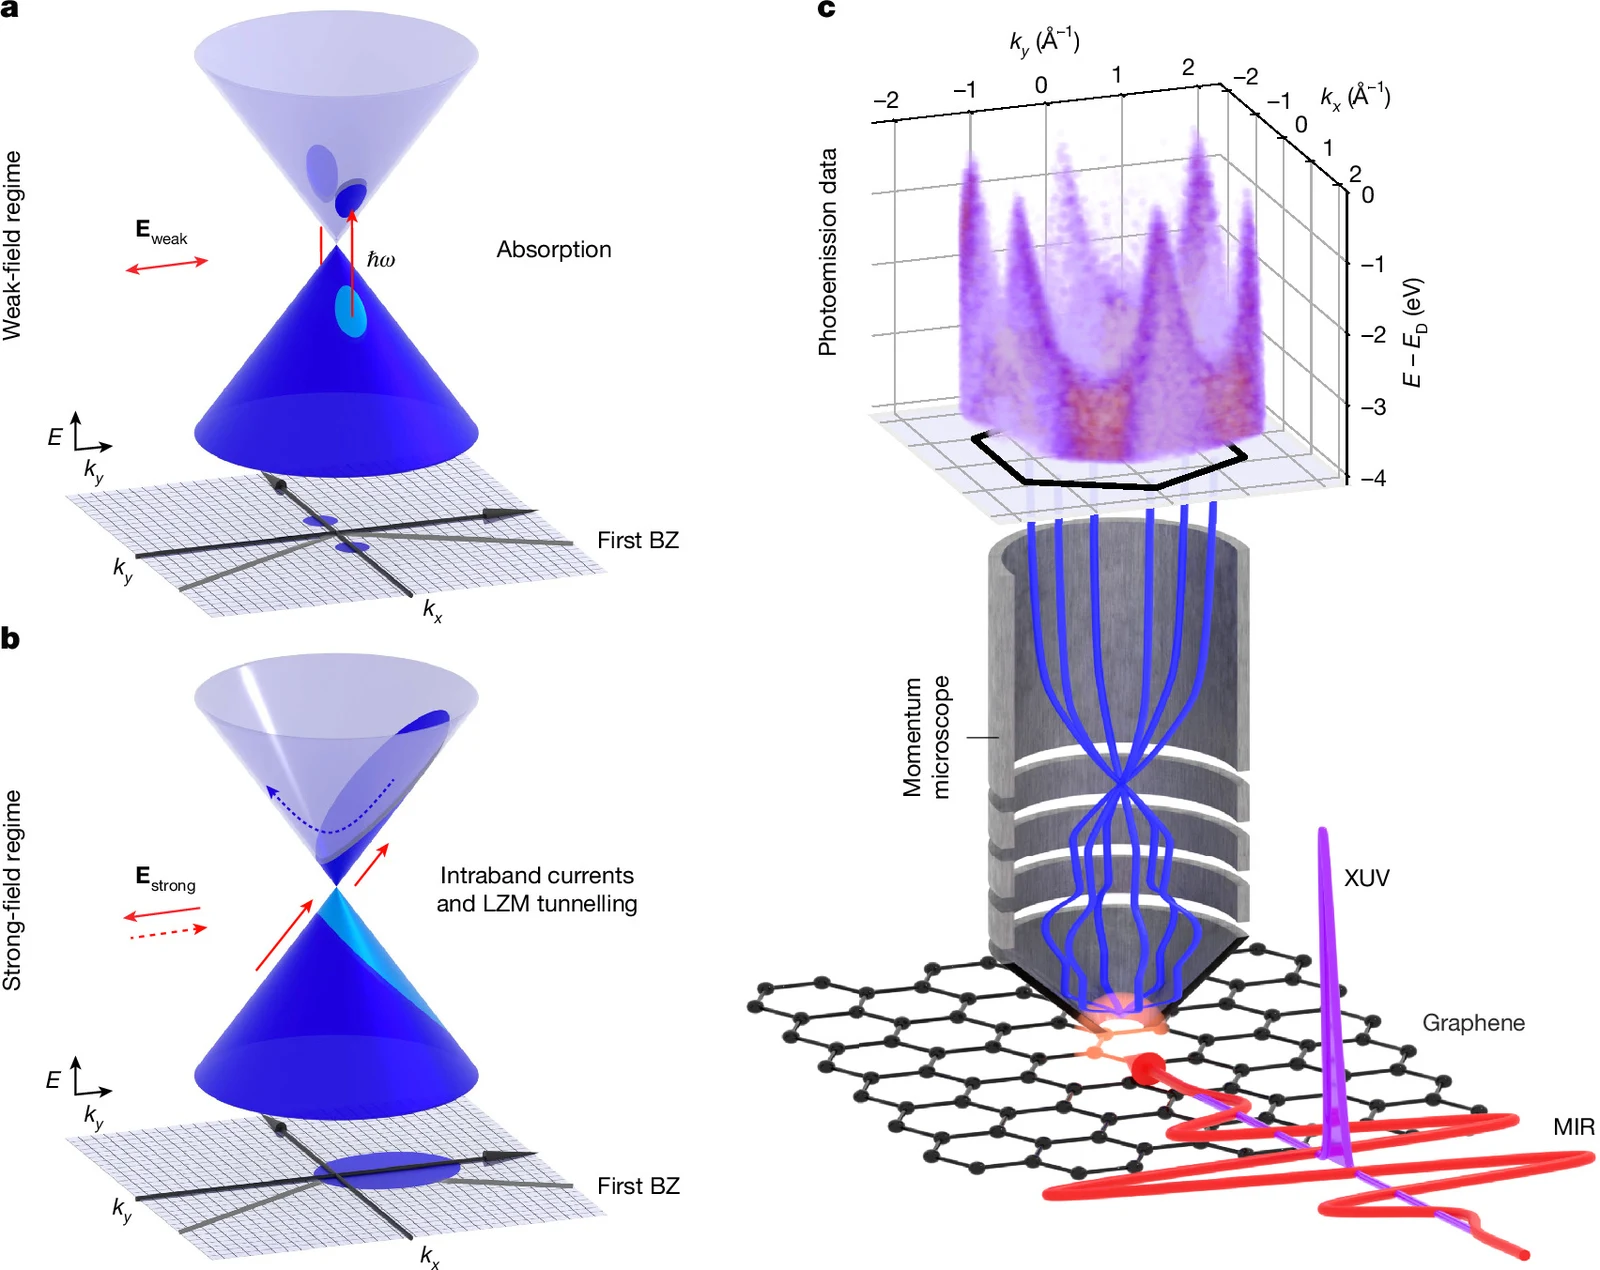
Image credit
Figure 1: graphene band structure and experimental arrangement
V. Eggers et al. · CC BY 4.0Resized and encoded as WebP; no semantic alteration.
Figure 1 combines explanatory band diagrams and the experimental arrangement. Credit: V. Eggers et al., Nature, DOI 10.1038/s41586-026-11214-y.
One Pulse Drives; Another Probes
A strong, phase-stable mid-infrared pulse drives the graphene. After a controlled delay, an extreme-ultraviolet pulse ejects electrons that are measured by a photoemission momentum microscope. Their measured energy and momentum provide information about the occupied electronic states.
Changing the delay builds a sequence of snapshots relative to the driving field. The arrangement combines time resolution with a broad view across the material's first Brillouin zone, the repeating momentum-space region used to describe its electronic structure.
That wider field of view is a central advance in the paper. Previous subcycle approaches had more limited momentum access. Looking over a larger region makes it possible to follow redistribution that could be missed by observing only a narrow slice.
The method is therefore not just about making a familiar recording faster. It changes which parts of the dynamics are available to compare. Timing, energy and momentum have to be interpreted together.
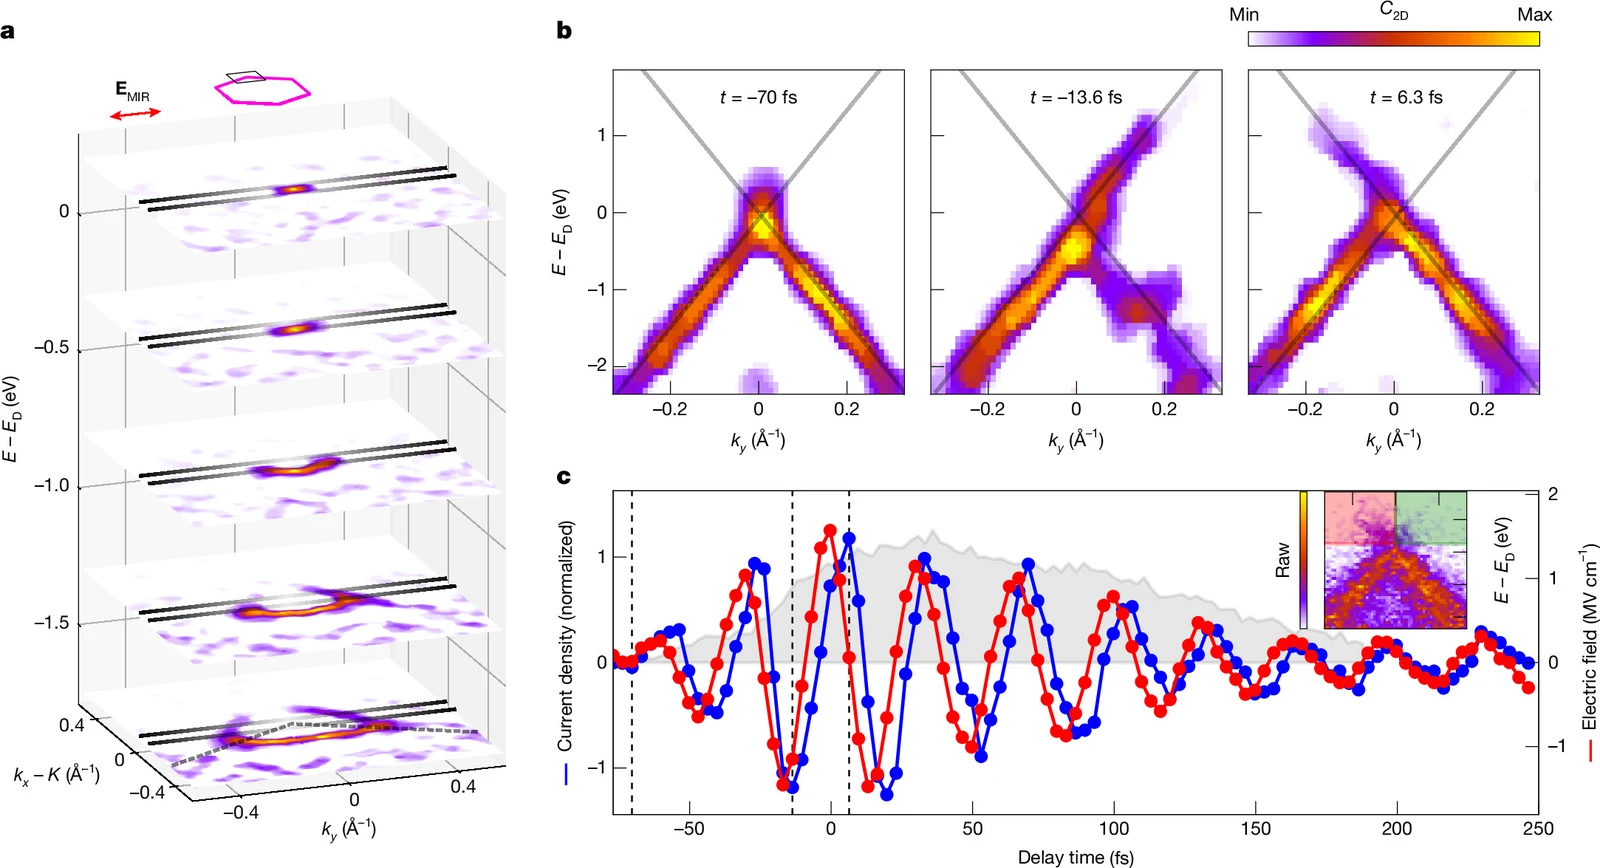
Image credit
Figure 2: measured band distributions and current timing
V. Eggers et al. · CC BY 4.0Resized and encoded as WebP; no semantic alteration.
Figure 2: measured electronic distributions and timing traces with the paper's annotations. Credit: V. Eggers et al., Nature, DOI 10.1038/s41586-026-11214-y.
What Is Making the Quantum Transition?
The process studied is Landau-Zener-Majorana tunnelling. In this setting, a sufficiently strong time-varying field can drive transitions between the electronic bands of graphene while also accelerating carriers within a band.
The paper distinguishes this strong-field behavior from the simpler picture of weak-light absorption. It examines how the combination of intraband motion and interband transitions produces the observed distribution. The maps and calculations are tools for testing that explanation, not evidence that electrons have started ignoring the constraints of the material.
One revealing comparison is between the distribution being pushed away from its initial position and its subsequent elongation. At later delays, scattering also changes the distribution. Keeping those processes separate is part of understanding how coherent control gives way to redistribution and relaxation.
That is why a visually striking frame is not sufficient on its own. The interpretation depends on the driving field, the delay, the measurement corrections and the model comparison, as well as the colors in the image.
Attosecond Precision Is Not the Same as Frame Resolution
The phrase attosecond precision needs care. The paper reports sub-10-femtosecond experimental resolution and uses analysis of the oscillating signals to extract a relative phase delay with attosecond precision. A femtosecond is a thousand attoseconds.
Those statements describe different properties of a measurement. Precisely estimating the timing relationship between signals does not mean that every image is an independent exposure with an attosecond-long shutter interval.
For example, the study reports an average phase delay of 4.9 plus or minus 0.2 femtoseconds for one comparison. The uncertainty in that estimated delay can be finer than the resolution of an individual snapshot. Treating the two numbers as interchangeable would exaggerate what the apparatus records.
A Better View of a Control Problem
The work concerns fundamental light-driven dynamics in a carefully prepared graphene system. It does not announce a finished ultrafast processor, a new consumer camera or a device that has solved the energy cost of computing.
Its value is more specific: it gives researchers a broader experimental view of processes that theories of lightwave control need to explain. The result connects an observed current with changes in the underlying electronic distribution, while keeping scattering and coherence in the same discussion.
Which would help you read this kind of experiment: a momentum-space explainer or a closer look at pump-probe timing? Tell us in the comments below.
Keep exploring
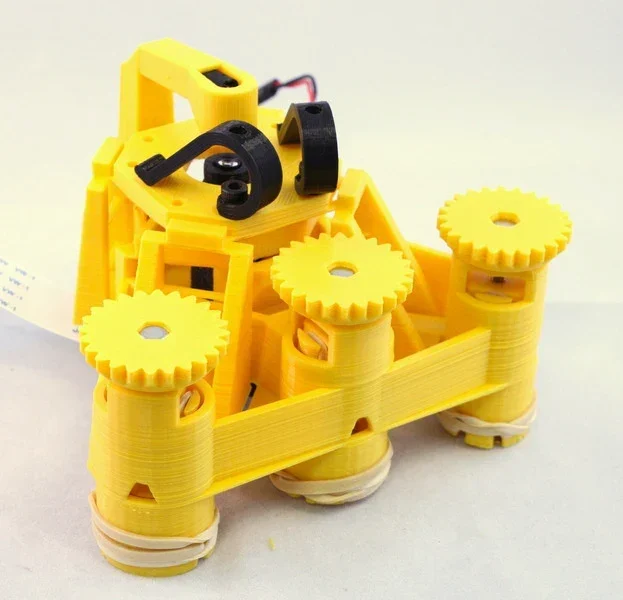
Richard Bowman and contributors' full microscope build instructions: printing, flexure actuators, two optical configurations, illumination, wiring, and motorization.
Image credit
docs/images/microscope_complete_1.jpg
Richard Bowman and OpenFlexure contributors · CERN-OHL-1.2Resized without cropping and converted to WebP for the project card.
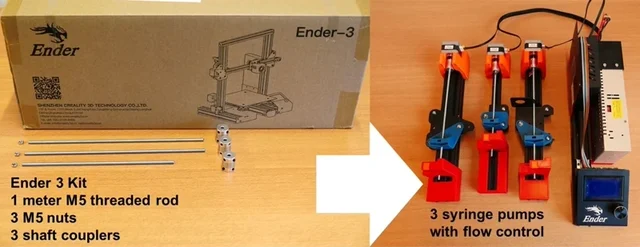
Sander Baas and Vittorio Saggiomo's open laboratory build: original project chapters, apparatus images, assembly and operating PDFs, and the characterization document.
Image credit
Figures/fig1.jpg
Sander Baas, Vittorio Saggiomo · MITResized without cropping and converted to WebP for the project card.
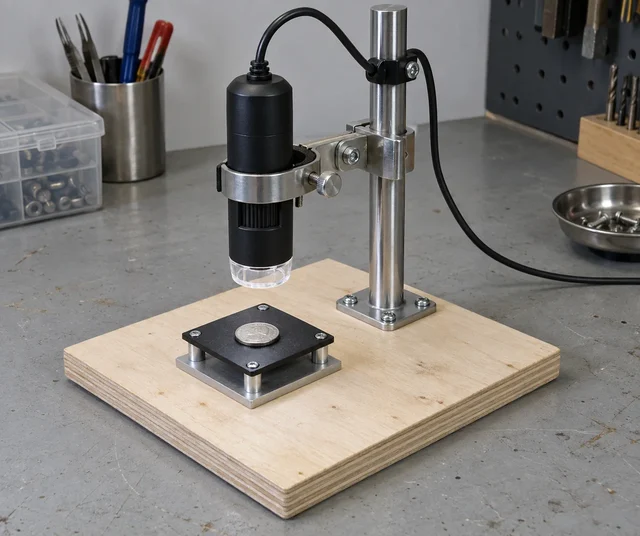
A simple fixture plan that separates focusing from the accidental movement of a lightweight microscope base.
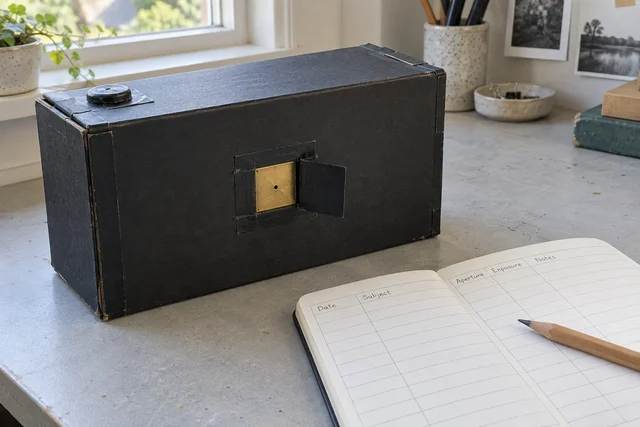
A reusable lensless camera plan, with the notes treated as part of the instrument rather than scraps to lose.
Comments
Member comments are temporarily unavailable.
Log in to join the discussion.